
ACCURATE – ACoustic CUe RATEs for passive acoustic density information

ACCURATE project aims to deliver a comprehensive, quantitative synthesis of the current state of knowledge on acoustic cue rates and cue stability for marine mammal density estimation from passive acoustics.
The ultimate goal is to determine the most appropriate cue rates to use in particular setting (considering different contextual settings). To achieve this, the project has several objectives:
To identify, review, compile and provide open access to all data available on cue rates (and their variability) across deep-diving and baleen species;
To develop methods to estimate cue rates from different data types (e.g. time depth-data) and for different taxa;
To apply these methods to species of interest for the Navy (including both deep divers and baleen whales);
To explore the factors that determine cue rate variability over time and space;
To evaluate impacts of cue rate variability on density estimates from cue-based methods;
To compile and make freely available all information gathered and produced within this project.
Funding information
Reference: ACCURATE N3943019C2176 Project 42
Funder website: Naval Facilities Engineering Systems Command
Partners


OBJECTIVES
Task 1 Bibliographic review and questionnaires to marine mammal researchers
ACCURATE will begin with a comprehensive bibliographic research and contacting researchers involved in PAM work to understand existing unpublished data sources. Datasets containing relevant information that might be currently ignored or have not yet been processed for the purposes of estimating acoustic cue rates will be identified and processed. Different methods for cue rate estimation, existence of different types of cue rates and optimal choice of cue will be investigated. The outcome will be a user-friendly data repository that enables Navy users to find the most appropriate cue rate to select in PAM-DE efforts for a given priority species and area, made freely available to the wider community. This will also allow identification of priority areas where there is currently insufficient knowledge that might form the basis of future investment in cue rate estimation.
Task 2 Estimating cue rates from tag data
Tag datasets which were already secured and where possible those identified in Task 1 will be processed and analyzed to estimate cue rates for species of interest for the Navy. For each tag and cue type all the focal animal cues will be counted, hence obtaining a cue rate per tag. This represents estimates of cue rate per tag, which can be combined in a cue rate per species. In task 3 such data will be used to explore the variability of cue rates across a range of factors, exploring model-based approaches. We will estimate cue rates for at least Cuvier’s beaked whale, Blainville’s beaked whale and the sperm whale. Time allowing, data from pilot whales, Risso’s dolphins and narwhals might also be analyzed. There is also the potential to analyze data from several other species identified in Task 1.
Team members: Kalliopi Gkikopoulou
Task 3 Assessing factors informing sue rate stability
Cue rate changes over time and space will be investigated to understand the main drivers of cue rate variability. Covariates that may be used to predict cue rate at times and locations where they are not measured will be considered, as well as covariates that may not always be available in a particular setting, but that enhance the understanding of cue production. Such covariates would enable the evaluations of potential biases of the existing tag datasets. Using the datasets identified previously, key drivers of cue rate variability across a range of taxa will be explored and identified. Factors affecting cue rates might be as diverse as time of day, sex, season, depth, species, population, sub-population, behavioral state, and worse of all, density itself. Models will be built predicting cue rate as a function of possible factors of interest, providing a framework to estimate cue rate for other times and places based on available covariates.
Task 4a Methods for cue rate estimation in baleen whales
For large baleen whales, identifying cues of the tagged whale from the tag can be challenging due to close amplitude of nearby animals. A variety of methods will be investigated, and the work will be carried out using data on blue, fin, right and humpback whales. Some of these data sets or approaches could be also used for Task 4b, in particular inferring presence of acoustic cues in tag data that do not have an acoustic data stream. The results will also be used to improve cue rate estimates for these species as applicable (Task 2) and will improve the breadth of the results obtained under tasks 5 and 6. While it is anticipated that preliminary cue rates might be available for these species already when ACCURATE starts under these projects, these have also revealed that additional work will be required to obtain completely reliable cue rates, namely working with non-acoustic data streams. Within ACCURATE the plan is to further develop methods for assigning cues to focal tagged animals.
Team members working on this task: Ana Širović, Susan Parks, Julia Dombroski
Species considered: Right whale (Eubalaena sp), fin whale (Balaenoptera physalus), blue whale (Balaenoptera musculus), humpback whale (Megaptera novaeangliae)
Data available: We are working with sensor and acoustic data collected using a range from biologging devices (D-Tags, B-probes, and Acousondes) deployed on baleen whales across 20 years of collaborative research at a variety of locations.
Approach taken: The assumption that only calls emitted by the tagged individual can be detected both in the accelerometer and in the acoustic data streams of multisensory biologging devices is widespread in the field of cetacean bioacoustics. We are systematically testing this assumption by investigating how social context, tag positioning, tag type, call characteristics (i.e., frequency and received levels), and sampling rate of accelerometer data affect the strength and quality of accelerometer signature of calls.
Progress: We have developed a graphical user interface to synchronously process acoustic and accelerometer data. We have gathered over 400 samples of calls + corresponding sensor data from blue and fin whales in multiple contexts and after an exploratory analysis to select parameters that contribute to variability of presence and quality of accelerometer signature of calls, we are starting a comprehensive analysis.
Outputs: Peer-reviewed paper (in prep).

Figure 1: Northeast Pacific blue whale (B. musculus) B call on the audio spectrogram (top panel) and on the spectrogram created using each axis of the accelerometer (next 3 panels) of an Acousonde tag. Audio spectrogram settings: FFT 256, Hann Window, 90% overlap. Accelerometer spectrogram settings: FFT 256, Hann Window, 90% overlap.
Task 4b Estimating cue rate from proxy data
In some cases, direct information about acoustic cue production rate might not be available. However, some variables available from non-acoustic tags (for example behavioural state) may correlate with cue rates, and hence be potentially useful for estimating acoustic cue rate. Once such model is developed, it can also be used to estimate behavioral states in tag data without acoustic sensors and make inferences on cue rate based on those estimated states. Datasets for 3 species (sperm whale, Cuvier’s beaked whale and narwhal) have been identified for this task. There might be other historical datasets, where non-acoustic information might be used to derive cue rate estimates, along the lines described above. If such datasets are identified under Task 1 we might extend task 4b to them.
Team members: Tiago Marques
Task 4c Investigating cue-rate variability of deep-divers due to geographic region, behavioral state and group size and composition
Previous research on deep-diving cetacean species has shown that geographic differences in acoustic behavior must be considered when using acoustic cues for abundance estimation in a new region (Douglas et al. 2005, Warren et al. 2017). This task will focus on sperm whales and will utilize archived data from combined visual and acoustic surveys to assess cue rate variability in two LMR priority geographic regions. The data available include recordings from towed passive acoustic arrays, with concurrent visual sightings during daytime hours, as well as recordings from drifting passive acoustic buoys.
Team members working on this task: Yvonne Barkley, Karlina Merkens, Erin Oleson
Species considered: Sperm whale (Physeter macrocephalus)
Data available: Passive acoustic towed array data were collected as part of 5 years of visual/acoustic surveys in the Main Hawaiian Islands in the Central North Pacific Ocean. Continuous acoustic recordings were collected using custom-built hydrophone arrays (Figure 1) towed at approximately 4-10 m deep, 300 m behind the ship while traveling at 18.5 km/h (10 kt). The components of the towed hydrophone arrays and data acquisition systems varied between surveys (Table 1). During daylight hours, trained acousticians monitored the sounds aurally with headphones and visually using spectrographic software (ISHMAEL, Mellinger 2001; PAMGuard, Gillespie et al. 2008). When cetacean vocalizations were detected, a phone-pair bearing algorithm in ISHMAEL or PAMGuard was used to calculate the direction of the sound source relative to the bow of the ship. These bearings were plotted using a mapping software with a GPS interface (PAMGuard; Whaltrak, by Jay Barlow). Target motion analysis was used to estimate the perpendicular distance to the animals based on the convergence of plotted bearings with left/right ambiguity. In some cases, the ambiguity in perpendicular distances was resolved if the ship turned while the animals were still vocalizing. Acoustic encounters were linked to concurrent sightings when acoustic bearing estimates were consistent with the sighted location of the animal group (Rankin et al. 2008). When the ambiguity of the acoustic location estimate could not be resolved, the average perpendicular distance from both sides of the ship was recorded. A total of 327 acoustic encounters of sperm whales were detected. A total of 72 sperm whale encounters were concurrently detected by both visual and acoustic methods and 242 sperm whale encounters were detected by acoustic methods only, and only 13 sperm whale encounters were only detected by visual methods (Table 1, Figure 2).

Figure 1. Diagram of the linear hydrophone array towed 300 m behind the NOAA research vessels at approximately 10 m deep during a cetacean abundance line-transect survey. The line array consisted of two depth sensors (denoted with ‘D’) and two array nodes spaced 20 m apart, each housing three hydrophones (black dots) spaced approximately 1 m apart.

Table 1. Summary table with survey information, acoustic equipment, and total sperm whale encounters detected during PIFSC cetacean surveys within the Hawaiian Archipelago, excluding DASBR recordings.

Figure 2. Map of sperm whale encounters collected using towed hydrophone arrays within the Hawaiian Archipelago between 2010 and 2017. Concurrent sightings and acoustic encounters from towed arrays are shown as orange dots. Acoustic encounters from towed arrays without a concurrent visual sighting are shown as green stars, and visual sightings without acoustic data are shown as purple triangles.
Approach taken: Sperm whale echolocation clicks are identified based on their low frequency, long duration, and high amplitude characteristics. Four main click types exist, which are associated with different behaviors (Figure 3). When estimating sperm whale click rates for acoustic density estimation, it is important to consider different factors that may affect click production and detectability. Therefore, we are analyzing the data by considering the click type, the number of whales in a group, and their distance from the ship (Figure 4). Subsequently, the first set of acoustic encounters for analysis aims to minimize the impact of click detectability by only including groups of 1-2 animals producing regular and/or slow clicks located close enough to the ship where the effects of sound propagation are negligible (within 4 km). This initial subset of data will provide baseline results where we assume all clicks are detected to obtain accurate estimates of click rate, which can then be adjusted for sperm whale acoustic encounters with larger groups located farther away or in other cases where detectability may be influenced. Further analysis will also include comparing sperm whale group sizes obtained by visual observers with click rates measured from the towed array data to better understand the relationship between visual and acoustic group size estimates and between group size and click rate.

Figure 3. Spectrograms show four types of sperm whale echolocation clicks (dark gray vertical lines) present in the towed array data set that correspond to different behavioral states, including regular clicks (a), creaks (b), codas (c), and slow clicks (d). Each click type is differentiated by their inter-click interval, or time between clicks. Click types are also associated with different behaviors, such as foraging (a, b), socializing (c), and male communication (d).

Figure 4. Initial data set consisted of sperm whale acoustic encounters with less than 10 animals producing only foraging clicks (regular and creaks) and/or slow clicks within 4 km of the ship to support the assumption that every click is detected.
Progress: The initial data set of acoustic encounters containing regular and slow clicks is currently being processed. Since the towed array data contain variable noise levels (primarily due to noise from water flow and ship propellers), we are using a combination of automated click detectors with manual validation to annotate all echolocation clicks within each acoustic encounter. So far, we have analyzed a total of 17 encounters lasting between 2.4 – 120.5 minutes (mean = 64.3 minutes) and total clicks ranging from 23-9101 clicks per encounter (mean = 1710 clicks) (Figure 5). Preliminary click rates range from 0.05 – 1.78 clicks per second (Figures 6 & 7), with longer interclick interval (>10 s) giving insight on the proportion of time animals are quiet within an encounter event (Figure 8). We will continue to update these results as more acoustic encounters are analyzed.
We have also determined that some acoustic encounters have much higher noise levels depending on the towed array used, generally differing from year to year. Noise measurements for all acoustic encounters will be calculated to characterize the overall background noise to assess whether all acoustic encounters can be considered together or should be separated based on noise, which may impact detection performance.

Figure 5. The total number of clicks per acoustic encounter (n = 17) over the encounter duration scaled by click rate (clicks per second).
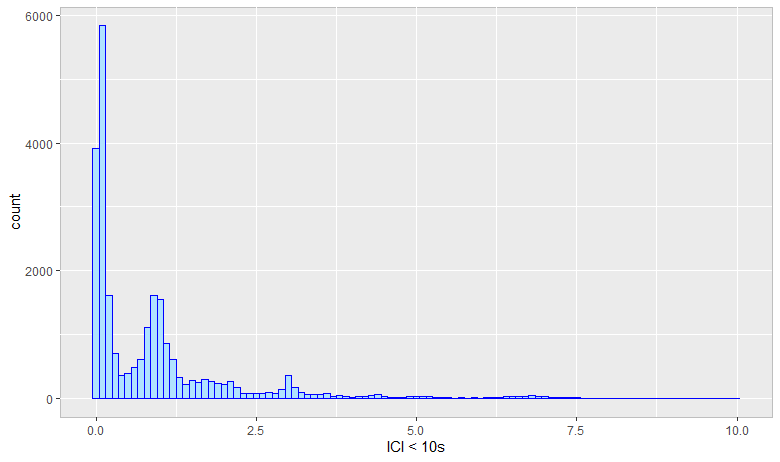
Figure 6. Interclick intervals of sperm whale echolocation clicks shorter than 10 s.

Figure 7. Interclick intervals of sperm whale echolocation clicks shorter than 2 s representing foraging clicks and slow clicks.

Figure 8. Interclick intervals of sperm whale echolocation clicks longer than 10 s can provide insight about the proportion of time sperm whales are quiet.
Task 4d Investigating inter-click interval patterns for deep divers
Investigating inter-click interval (ICI) patterns will feed directly into considerations of factors driving cue rates such as time of day, season, geographic location, population or behavioral state. Odontocete studies have shown a modal distribution of inter-click intervals (ICIs), which also appear to be species-specific. While there generally is a preferred signalling rate, this may vary dependent on several factors. We propose to investigate a comprehensive dataset for Cuvier’s and Blainville’s beaked whales as well as sperm whales with which analysis of ICI variability across time and space will be possible. Long-term datasets collected over multiple years will provide temporal, whereas data from multiple sites within a smaller geographic region will document variability across sites. The potential for comparing these data with DTAGs collected in similar places and times will be considered.
Team members: Simone Bauman-Pickering, Jenny Trickey
Task 4e Estimating cue rates when the detector/classifier influences the cue definition
ACCURATE project will investigate which ‘cue’ is the most stable for deep diving animals using a combination of empirical and simulated data. The choice would be driven by which cue as defined from the detection system is more stable and easier to detect with a high efficiency and low false alarm rate with a minimum of operator input. A simulation tool will be used to examine the cue passive detection system and cue characteristics that might affect detectability, starting with a deep diver species. The detection system will model the cue detectors of the field to identify the underlying relation between cue production rate and cue detection rate, other than the relationship of decreasing detectability due to distance.
Team members: Douglass Gillespie, Kalliopi Gkikopoulou
Task 5 Assessing impacts of cue rate variability
Building on the previous tasks, a simulation exercise will be used to evaluate the potential consequences of erroneously using biased cue rates for PAM-DE, as well as what might be the impacts of using different cues (with different characteristics) in cue-based density estimation exercises. This will provide guidance regarding how one should interpret the density estimates derived using cue rates from times and places other than the main PAM survey.
Task 6 Results dissemination, assessment of appropriate cues and recommendations
The project will compile a data-repository of the summary data collected on acoustic cue rates as part of Task 1. As this develops throughout the ACCURATE project will explore the best approach to dissemination. The data format will be finalized during the project in coordination with all project partners to ensure that the most useful metadata is stored in a standardized and user-friendly format. We will host a workshop on cue rates, what information is available, how to use it, what might be the best way to choose between different cues, etc. Following the delivery of the database outlined in Task 1, updated with the expected project outputs of Tasks 2 and 4 and the workshop described above, appropriate cues for different species/context combinations will be indicated and a robust set of recommendations regarding the most appropriate species to collect further cue rate data for and the technical approaches required to achieve this will be outlined.